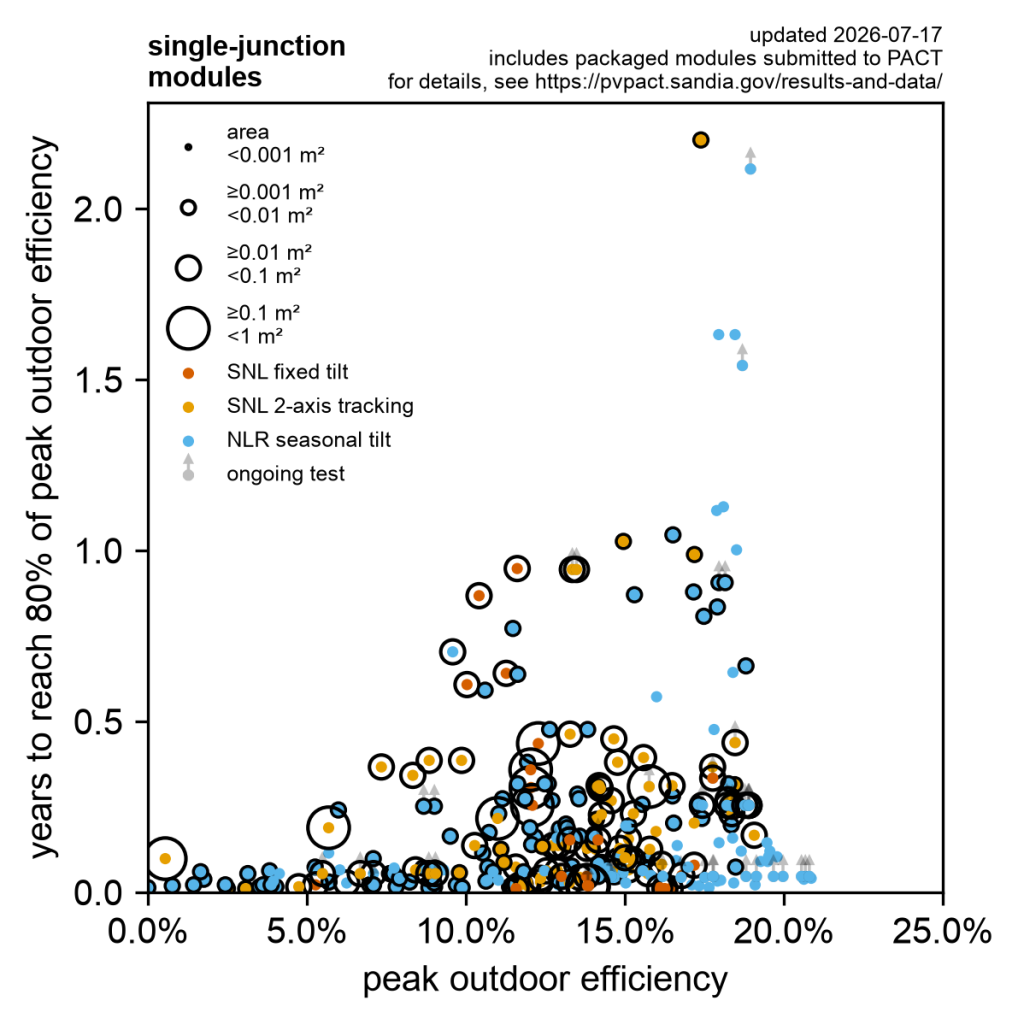
Updated PACT field performance plot – Single Junction Modules
The field performance plot below shows a ring for each single-junction perovskite module PACT has field tested at its NLR site in Golden, Colorado and Sandia (SNL) site in Albuquerque, NM. The horizontal position of the ring shows the module’s peak daily efficiency. The vertical position shows the time to reach 80% of peak daily efficiency. The area of the ring is proportional to the aperture area of the module.
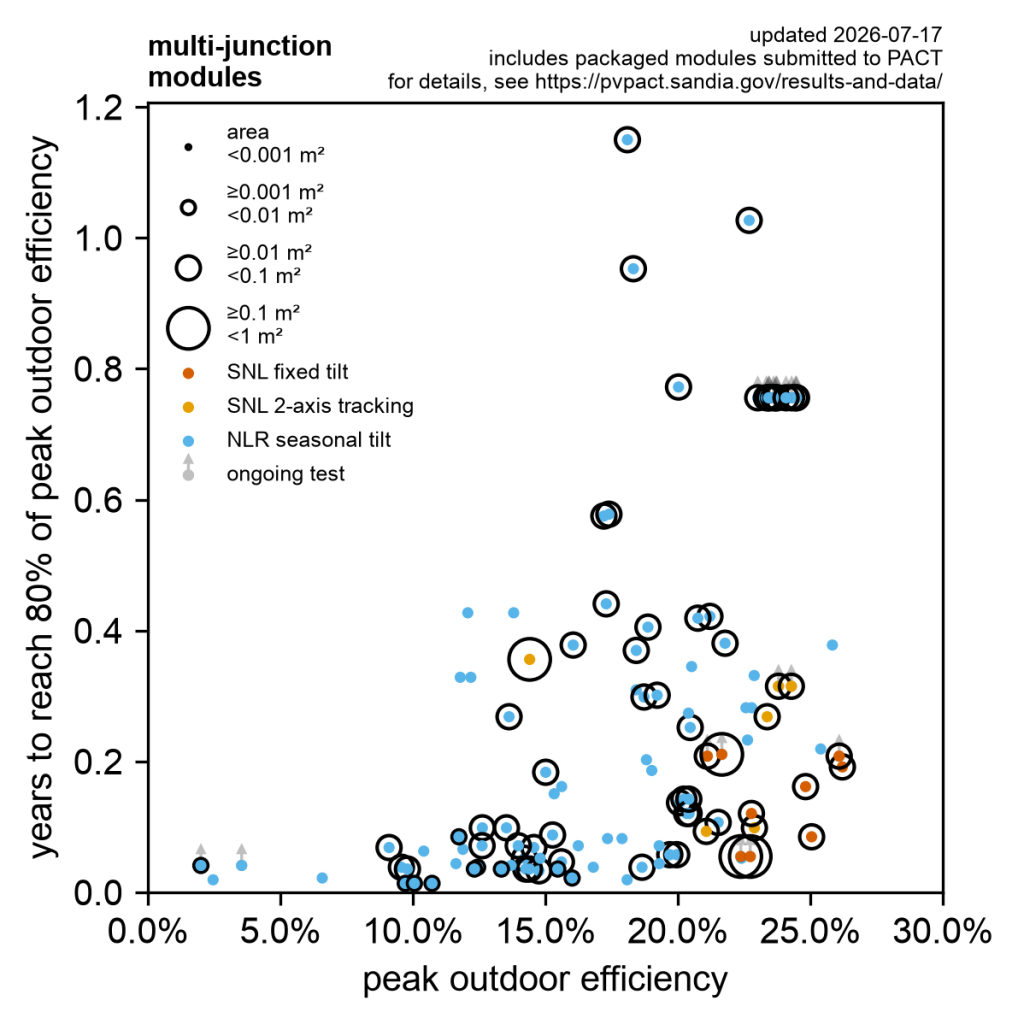
PACT field performance plot – Multi-Junction Modules
The field performance plot below shows a ring for each multi-junction perovskite module PACT has field tested at its NLR site in Golden, Colorado and Sandia (SNL) site in Albuquerque, NM. The horizontal position of the ring shows the module’s peak daily efficiency. The vertical position shows the time to reach 80% of peak daily efficiency. The area of the ring is proportional to the aperture area of the module.
Peak efficiency
Our calculations use peak daily efficiency. Daily efficiency is the daily energy delivered by the PV device divided by the daily energy incident on the device. In multi-junction modules, the daily energy delivered is the total energy delivered by all junctions, regardless of how many terminals are used to connect the module. Incident power is the irradiance measured by a broadband pyranometer (see Measurement details) multiplied by the device aperture area (see Aperture area).
For each day in the dataset, the median daily efficiency value of the previous 5 acceptable days (including the current day) is determined. This creates a series of median values over time. Once this moving median is calculated, the highest (maximum) value is identified, and that value is considered the “peak.” Acceptable days are identified using the Data filtering details, below.
We do not correct power measurements for temperature, spectrum, or angle of incidence. Mature performance models are not available for perovskite PV devices in general. And devices tested in PACT are of such diverse construction and composition that batch-specific performance models would be necessary. These are also not available.
Years to 80%
We report the number of years before a device falls below 80% of its peak daily efficiency for three consecutive acceptable days. All days before this point, including unacceptable days, are counted.
Aperture area
If a physical aperture mask is present, we use the area inside it. Otherwise, we use the area of the smallest rectangle that contains the entire active area.
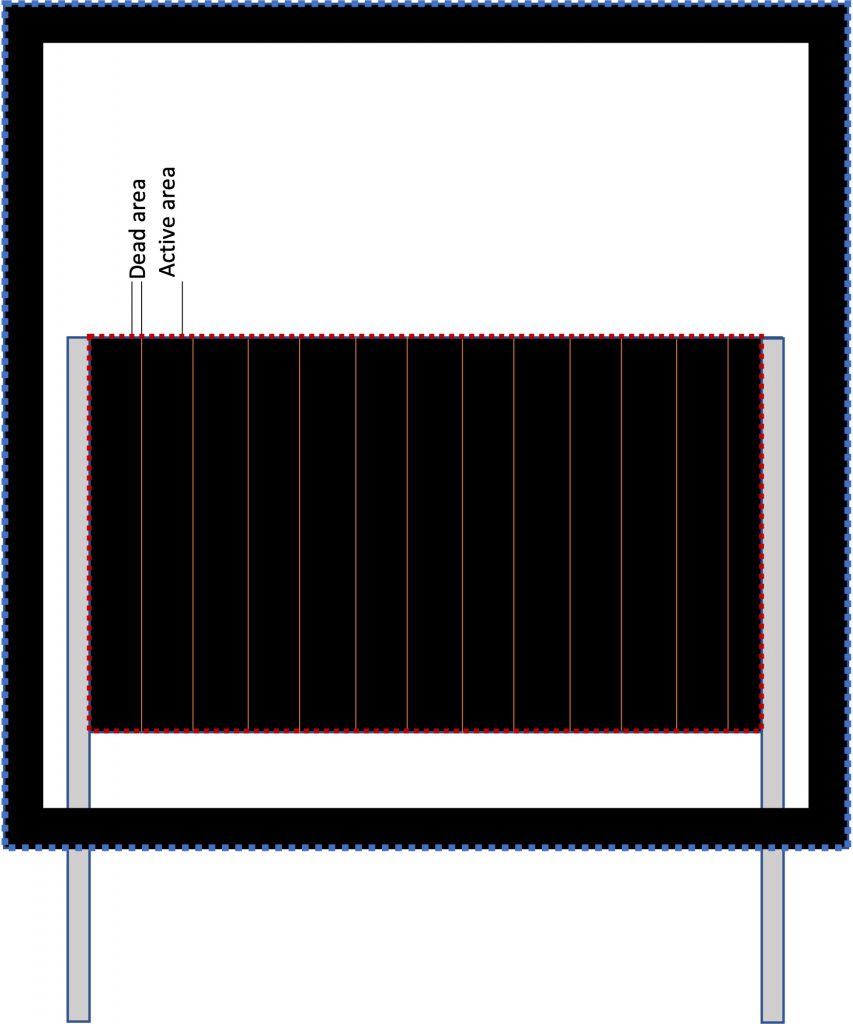
Adapted from: Xuezeng Dai et al. PRX ENERGY 1, 013004 (2022)
In the diagram to the left, a notional square minimodule is shown with an outside edge seal with a smaller area inside representing a monolithically integrated thin-film PV device with laser-scribed cells in series. The total module area is inscribed with a blue dashed line. The aperture area is shown inside the dashed red line. The active area is the area converting light into electricity (not including the dead area (e.g., scribing lines and area between scribing lines not contributing to current). The geometric fill factor (GFF) is the ratio of the aperture area to the total module area.
Site details
PACT modules are tested at three different sites:
Sandia National Laboratories
The Sandia field site is at 35.054972°N, -106.541049°W at approximately 1657 m above mean sea level. The test rack is a 2-axis tracker that keeps the modules normal to the Sun.
National Laboratory of the Rockies
The NLR field test site is at 39.740580°N, -105.177129°W at approximately 1785 m above mean sea level. The test rack is tilted at 60° above horizontal during the winter half of the year (between the autumnal equinox and the vernal equinox) and at 20° above horizontal during the summer half of the year (between the vernal equinox and the autumnal equinox).
CFV Labs
The CFV Labs site is located at 34.9965723°N, -106.62086°W at approximately 1632 m above mean sea level. The test rack is fixed-tilt at 40° above horizontal.
Measurement details
Irradiance is measured in the plane of the array using an ISO 9060 class A thermopile pyranometer.
PV devices are electrically loaded and measured using calibrated in-house active electronic loads. Devices are kept at their maximum power point during daytime and at short circuit at night.
Snow on the modules or instruments is monitored using human analysis of imagery from a fixed camera.
Data filtering details
Acceptable days are those where there is no visible snow on the array or instruments, the total insolation is at least 4 kWh/m2 (this excludes completely overcast days), and complete data are present for at least 80% of the time the sun is above zero elevation. Daily efficiency calculations consider only conditions when irradiance is above 100 W/m².
Daily energy does not include times when irradiance data are unavailable. Insolation and daily incident energy do not include times when power data are unavailable.
In certain cases, modules may show up on the plots and then later are removed. This is done when a monitoring or MPPT equipment failure or outage appears to cause damage to a module before it reaches T80.